Commercial lead generation and B2B appointment setting in San Francisco

San Francisco-Oakland has 9,941 business sites with 20 or more people on site in the categories commercial trades sell to, #14 of the 100 markets we cover, and 1.21 times the national concentration of apartment and residential property managers. Private business establishments grew 8.5% from 2025 Q1 to 2026 Q1. Abstrakt's U.S.-based reps prospect those buyers by phone, email and LinkedIn and book meetings with the people who sign.

Ask Ava anything about the information on this page.

Local B2B snapshot

How many businesses are in San Francisco-Oakland, and which ones buy

San Francisco-Oakland has 56,117 establishments in the categories commercial trades sell to, 9,941 of them with 20 or more people on site. Compared with the national mix it over-indexes on apartment and residential property managers (1.21x). Added over the past year: medical, dental and outpatient offices (+655), restaurants (+422) and apartment and residential property managers (+125). Down: retail stores (-46) and bank and credit union offices (-22).

  • 56,117 establishments in the 21 categories commercial trades sell to

    Source: U.S. Census Bureau, County Business Patterns 2023

  • 9,941 of them with 20 or more people on site, where a prospecting list starts

    Source: U.S. Census Bureau, County Business Patterns 2023

  • +8.5% private business establishments, 2025 Q1 to 2026 Q1 (235,362 now; U.S. +3.6%)

    Source: U.S. Bureau of Labor Statistics, Quarterly Census of Employment and Wages, private ownership, 2026 Q1

  • 1.21x the national concentration of apartment and residential property managers

    Source: U.S. Bureau of Labor Statistics, Quarterly Census of Employment and Wages, private ownership, 2026 Q1

  • 12,683 decision-maker records Abstrakt can prospect for a construction and roofing program (territory: 2 Abstrakt territories)

    Source: Abstrakt territory record counts, October 2026

An establishment is one physical location, so a company with three sites counts three times; decision-maker records are contacts, not companies; open programs are not reservations.

Largest buyer groups in San Francisco-Oakland

  1. Restaurants3,062
  2. Retail stores2,148
  3. Medical, dental and outpatient offices1,089
  4. Manufacturing plants842
  5. Wholesale distributors788
  6. Grocery stores542
  7. Senior living and nursing408
  8. Private K-12 schools284

Sites with 20 or more people on site, U.S. Census Bureau, County Business Patterns 2023; concentration, U.S. Bureau of Labor Statistics, Quarterly Census of Employment and Wages, private ownership, 2026 Q1.
All 21 categories, with establishments, concentration and one-year change
Business categories in San Francisco-Oakland: larger sites, all establishments, concentration and one-year change
CategorySites with 20+All establishmentsvs. U.S. mix1-yr change
Restaurants 3,06212,900 0.91x +422
Retail stores 2,14812,038 0.55x -46
Medical, dental and outpatient offices 1,08911,176 0.80x +655
Manufacturing plants 8423,398 0.55x +2
Wholesale distributors 7885,144 0.43x +5
Grocery stores (also counted in retail) 5422,374 0.79x +22
Senior living and nursing 4081,448 0.81x +49
Private K-12 schools 284445 1.01x +3
Hotels 270709 0.63x +11
Bank and credit union offices 2562,202 0.50x -22
Hosting and data processing companies 204744 1.00x +21
Auto dealerships (also counted in retail) 171344 0.36x +8
Churches and religious organizations 1271,425 1.00x -6
Trucking companies 1231,580 0.48x +69
Apartment and residential property managers 641,322 1.21x +125
Warehousing and distribution 62214 0.40x 0
Hospitals 57125 0.36x +54 *
Golf courses and country clubs 5262 0.29x +2
Commercial property managers 42407 1.09x +7
Colleges and universities 3765 0.33x -5
Nonresidential building owners 26713 0.87x +7
Total, each site once9,94156,117

Sites and establishments: U.S. Census Bureau, County Business Patterns 2023; concentration (location quotient) and one-year change in establishments: U.S. Bureau of Labor Statistics, Quarterly Census of Employment and Wages, private ownership, 2026 Q1, summed across the metro's counties. * More than half the prior year's count (hospitals). QCEW counts move when an employer changes how it reports its locations, so treat this as a reporting change until confirmed.

Your industry in San Francisco

What Industry Are You Growing In?

Pick your trade to see the San Francisco-Oakland buyers, competition, decision-makers and projects for it. The estimator and the assessment form below follow your choice.

Choose an industry

Every trade in San Francisco at a glance

Largest buyer groups (sites with 20+ people)

  1. Restaurants3,062
  2. Retail stores2,148
  3. Medical, dental and outpatient offices1,089
  4. Manufacturing plants842
  5. Wholesale distributors788

Source: U.S. Census Bureau, County Business Patterns 2023.

Most room per contractor

  1. Commercial Painting & Coatings#3 of 86
  2. Paving & Asphalt#4 of 94
  3. Commercial Roofing#4 of 89

Larger buyer sites per contractor, ranked across up to 100 markets. Sources: U.S. Census Bureau, County Business Patterns 2023; U.S. Bureau of Labor Statistics, Quarterly Census of Employment and Wages, private ownership, 2026 Q1.
Trade panels: buyer sites, U.S. Census Bureau, County Business Patterns 2023; contractors, their one-year change and employment, U.S. Bureau of Labor Statistics, Quarterly Census of Employment and Wages, private ownership, 2026 Q1; decision-maker records, Abstrakt territory record counts, October 2026; open programs, Abstrakt territory availability.

Compare all 11 trades in San Francisco

Ranked by larger buyer sites per contractor against up to 100 markets (only markets with 10 or more contractors in a trade are ranked; n/r means not ranked). A higher rank means more buildings worth calling for every competitor working them.

Commercial trades in San Francisco: contractors, buyer sites and rank
TradeContractors1-yr changeLarger buyer sitesPer contractorRankDecision-maker records
Commercial Painting & Coatings
Largest buyer group: retail stores
60 +1 6,456 107.6 #3 not counted
Paving & Asphalt
Largest buyer group: retail stores
79 -2 6,261 79.3 #4 not counted
Commercial Roofing
Largest buyer group: retail stores
41 +2 6,175 150.6 #4 12,683
Commercial Flooring
Largest buyer group: apartment and multifamily management companies
32 -2 4,550 142.2 #4 not counted
Commercial Electrical
Largest buyer group: retail stores
361 +18 4,878 13.5 #14 not counted
Commercial Landscaping
Largest buyer group: retail stores
1,237 +44 6,573 5.3 #14 not counted
Commercial HVAC & Mechanical
Largest buyer group: medical and dental office buildings
286 +7 3,660 12.8 #20 5,014
Fire Protection
Largest buyer group: restaurants
123 +3 6,751 54.9 #24 not counted
Commercial Construction
Largest buyer group: manufacturing companies
570 +1 3,316 5.8 #28 12,683
Commercial Cleaning & Janitorial
Largest buyer group: ambulatory health care: physician, dental, outpatient and urgent care
1,211 +41 4,264 3.5 #60 3,714
Managed Service Providers
Largest buyer group: construction contractors
3,002 +236 6,338 2.1 #72 not counted

Sources: contractors and change, U.S. Bureau of Labor Statistics, Quarterly Census of Employment and Wages, private ownership, 2026 Q1; buyer sites, U.S. Census Bureau, County Business Patterns 2023 (each trade's own buyer categories, each site counted once); decision-maker records, Abstrakt territory record counts, October 2026.

Growth and trends

Is San Francisco-Oakland adding businesses? Five years of counts

Private business establishments in the metro's counties went from 201,904 in 2021 to 222,839 in 2025 (+10.4%), while private employment moved +2.3% to 2,055,798. In the Census Bureau's latest count, 12,649 establishments opened and 11,807 closed in a year. New sites start without an incumbent vendor.

Private establishments and employment, 2021 to 2025

Private establishments, employment and average weekly wage by year, San Francisco-Oakland
YearEstablishmentsEmploymentAvg weekly wage
2021201,9042,008,809$2,659
2022206,3122,125,423$2,405
2023209,9522,112,343$2,529
2024220,0882,082,909$2,673
2025222,8392,055,798$2,903

Source: U.S. Bureau of Labor Statistics, Quarterly Census of Employment and Wages (opens in a new tab), private ownership, 2021 to 2025 annual averages, 5 counties summed. n/a: BLS withholds the figure for at least one county.

Establishments opened and closed each year

Establishment openings and closings by year, San Francisco-Oakland-Fremont, CA
Year to MarchOpenedRateClosedRate
201912,18510.4%10,8199.3%
202012,61510.7%11,6759.9%
202112,42710.6%15,19813.0%
202214,94512.8%11,85310.1%
202312,64910.6%11,8079.9%

Source: U.S. Census Bureau, Business Dynamics Statistics (opens in a new tab), 2023 release, San Francisco-Oakland-Fremont, CA. Each year runs March to March; rates are per 100 establishments.

New business applications

70,367 applications for an employer ID number were filed in the metro's counties in 2025, +49.1% on 2019 (47,210): Alameda County 21,047, San Francisco County 20,682, Contra Costa County 14,264, San Mateo County 10,625, Marin County 3,749. Applications include sole proprietors and filings that never hire, so they measure new business activity, not new buyers.

Source: U.S. Census Bureau, Business Formation Statistics (county annual) (opens in a new tab), calendar 2025, retrieved 2026-10-15.

Contractors by trade, 2021 to 2025
Contractor establishments by trade, 2021 and 2025, San Francisco-Oakland
Trade20212025Change
Commercial Cleaning & Janitorial1,0431,190+147 (+14.1%)
Commercial Landscaping1,1261,205+79 (+7.0%)
Managed Service Providers2,6762,861+185 (+6.9%)
Commercial Painting & Coatings5860+2 (+3.4%)
Commercial Electrical334344+10 (+3.0%)
Paving & Asphalt8182+1 (+1.2%)
Commercial HVAC & Mechanical284282-2 (-0.7%)
Commercial Construction581568-13 (-2.2%)
Fire Protection126121-5 (-4.0%)
Commercial Flooring3533-2 (-5.7%)
Commercial Roofing4239-3 (-7.1%)

Source: U.S. Bureau of Labor Statistics, Quarterly Census of Employment and Wages, annual averages, the same NAICS codes as the trade comparison above. More contractors means more competition for the same buyers; fewer means more room for outbound.

When to prospect: the San Francisco calendar

Cooling demand peaks in August (99 cooling degree days in a normal year), and 85% of the 13 severe hail and wind reports from 2015 to 2024 fell in January, December and August. Start roofing and HVAC prospecting ahead of those months.

Average high temperature, cooling degree days and severe storm reports by month, San Francisco-Oakland
MonthAvg high (F)Cooling degree daysHail and wind reports
January5704
February5900
March6210
April6542
May69200
June74530
July77910
August78993
September77830
October72250
November6300
December5704

Sources: NOAA NCEI nClimDiv county monthly series, 1991-2020 averages (opens in a new tab); NOAA NCEI Storm Events Database (opens in a new tab), 2015 to 2024. Reports of hail 1 inch or larger and thunderstorm wind of 58 mph or more, by month, across the market counties.

Buying signals

Where the money is moving in San Francisco-Oakland

Federal contracts and building permits are early signs that a building is changing: new construction, a renovation, a re-roof.

Federal contracts performed in the metro

Federal agencies obligated $9.35 billion in contracts with a place of performance in San Francisco-Oakland's counties in federal fiscal year 2026 (October 2025 to September 2026), against $7.25 billion in fiscal 2025 (+28.9%). Construction (NAICS 23) took $350.5 million.

Contract obligations by county
CountyFY2026FY2025
Alameda County$6.11 billion$5.89 billion
Contra Costa County$870.9 million$641.9 million
San Francisco County$1.46 billion$515.4 million
San Mateo County$880.1 million$170.4 million
Marin County$28.6 million$34.2 million
Metro counties$9.35 billion$7.25 billion
FY2026 obligations in each trade's own NAICS code
TradeNAICSFY2026
Commercial Construction236220$151.3 million
Commercial HVAC & Mechanical238220$11.8 million
Commercial Cleaning & Janitorial561720$6.2 million
Paving & Asphalt237310$5.5 million
Commercial Landscaping561730$4.4 million
Managed Service Providers541512$4.2 million
Commercial Electrical238210$2.0 million
Commercial Roofing238160$1.3 million
Fire Protection561621$1.1 million
Commercial Flooring238330$270,854
Commercial Painting & Coatings238320$40,066

Source: USAspending.gov (U.S. Department of the Treasury) (opens in a new tab), contract award types A to D, obligations dated October 1, 2025 to September 30, 2026, by place of performance; data as of 2026-10-15. Defense contract actions are published 90 days late, so fiscal 2026 will still rise. Place of performance is coded by the contracting officer.

Commercial building permits

City and County of San Francisco issued 4,742 commercial permits from October 1, 2025 to September 30, 2026, 11 of them for new construction; the busiest month was Oct 2025 (495). Each count covers only the permits that authority issues, so they are not a metro total and do not add up across jurisdictions. City and County of San Francisco: Permits issued by the San Francisco Department of Building Inspection (the city and county are one jurisdiction).

City and County of San Francisco: commercial permits by type of work
Type of workPermits
otc alterations permit4,469
additions alterations or repairs261
new construction wood frame8
new construction3
sign - erect1

By proposed use: office 2,632 · food/beverage hndlng 532 · retail sales 457 · tourist hotel/motel 121 · school 111 · clinics-medic/dental 86. Proposed use as the Department of Building Inspection records it.

Commercial permits by month, table
Commercial permits issued by month and jurisdiction, Oct 2024 to Sep 2026
MonthCity and County of San Francisco
Sep 2026382
Aug 2026317
Jul 2026380
Jun 2026398
May 2026351
Apr 2026369
Mar 2026362
Feb 2026427
Jan 2026426
Dec 2025428
Nov 2025407
Oct 2025495
Sep 2025454
Aug 2025455
Jul 2025461
Jun 2025383
May 2025419
Apr 2025419
Mar 2025429
Feb 2025350
Jan 2025330
Dec 2024322
Nov 2024317
Oct 2024447

Sources: City and County of San Francisco, Building Permits (opens in a new tab) (City and County of San Francisco, Department of Building Inspection, PDDL 1.0 (opens in a new tab); proposed use is nonresidential (not a dwelling, apartment, residential hotel, group residence, live/work unit, accessory cottage, home day care, vacant lot, fence or blank), by issued_date). Retrieved 2026-10-15. Counts only; declared job values are applicant estimates and are not shown.

Territory intelligence

Where the San Francisco buyers are

Alameda County, San Francisco County and Contra Costa County hold 77% of the metro's 9,941 larger business sites, so most programs start there and add the rest of the metro for larger accounts, depending on how far your crews travel.

Larger business sites (20+ people) by county, San Francisco-Oakland-Fremont, CA
CountySitesShare
Alameda County 3,68137%
San Francisco County 2,11721%
Contra Costa County 1,84319%
San Mateo County 1,57516%
Marin County 5926.0%
Not assigned to a county by Census1331.3%
Metro total9,941100%

Source: U.S. Census Bureau, County Business Patterns 2023, metro and county files, summed across the buyer categories on this page (each site counted once). County files withhold some size-class counts that the metro file reports, so 133 sites cannot be placed in a county.

Abstrakt territories in this market

Oakland-Fairfield-Martinez, CA and San Francisco, CA. A strategist confirms which one your program would hold.

The owners that anchor San Francisco-Oakland

Each fact links to its source, checked 2026-10.

Health system

Kaiser Permanente Northern California

Oakland, Alameda County

Kaiser Permanente says its Northern California region, headquartered in Oakland, has 21 hospitals, 91,154 employees and 4.7 million members.

Hospitals and medical office buildings across the East Bay, San Francisco and the Peninsula give one owner a long list of facilities needing HVAC, life-safety, cleaning and flooring work.

HVACfire protectioncleaningflooringelectrical

Kaiser Permanente (opens in a new tab)
Campus

University of California, Berkeley

Berkeley, Alameda County

The Daily Californian reports UC Berkeley enrolled more than 46,000 students in fall 2025 for the first time in campus history.

A dense campus of older and new academic, lab and housing buildings carries steady mechanical, roofing, painting and cleaning work.

HVACroofingpaintingcleaning

The Daily Californian (opens in a new tab)
Major employer

Salesforce

San Francisco, San Francisco County

The San Francisco Standard calls Salesforce the city's largest private employer and says it occupies multiple buildings in SoMa, including Salesforce Tower.

Multiple downtown office buildings with heavy daily occupancy need janitorial, HVAC, electrical and interior finish work.

cleaningHVACelectricalflooring

The San Francisco Standard (opens in a new tab)
3 more anchor owners in San Francisco-Oakland
Major employer

Chevron Richmond Refinery

Richmond, Contra Costa County

Chevron says Chevron Richmond was established in 1902 and produces gasoline, jet fuel, diesel and lubricating oils.

A large refinery site with process units, tank farms, shops and office buildings carries electrical, fire protection, painting and paving work.

electricalfire protectionpaintingpaving

Chevron Richmond (opens in a new tab)
Airport

San Francisco International Airport (SFO)

San Mateo County (unincorporated, south of San Francisco)

The Mercury News reports SFO handled 54.53 million passengers in 2025, up 4.3% from 52.29 million in 2024.

Terminals, garages, the rental car center and airfield support buildings need cleaning, HVAC, electrical and pavement work.

cleaningHVACelectricalpaving

The Mercury News (opens in a new tab)
Logistics hub

Port of Oakland

Oakland, Alameda County

The Port of Oakland says it handled 1,114,665 TEUs through the first six months of 2026, 2.5% below the same period last year.

Marine terminals, container yards and the warehouses and transload buildings around them need paving, roofing, electrical and fire protection work.

pavingroofingelectricalfire protection

Port of Oakland (opens in a new tab)
Projects and economic activity

What is being built in San Francisco-Oakland, and who it puts to work

Named projects from primary and local news sources, researched September 2026. Market intelligence, not open bids: confirm timing with the owner.

UCSF Health Helen Diller Hospital, Parnassus Heights

Under wayUnder construction (structural steel), completion expected 2029

A 15-story hospital under construction at UCSF's Parnassus Heights campus in San Francisco, with first patients planned for 2030.

Structural steel and concrete work runs through summer 2027, after which mechanical, electrical and fire protection rough-in ramps up, followed by interior finishes and healthcare cleaning ahead of 2030 activation.

HVACelectricalfire protectionflooringcleaning

UCSF Real Estate, 2026-05-28 (opens in a new tab)

UCSF Benioff Children's Hospital Oakland New Hospital Building

Under wayUnder construction, completion expected 2031

A seismic replacement hospital building at UCSF Benioff Children's Hospital Oakland with an expanded emergency department, behavioral health beds, new operating rooms and a private-room NICU; the 31,300 sq ft Temescal Hall office building on the campus finished in September 2026.

A multi-year hospital build in Oakland creates mechanical, electrical and fire protection scopes now and interior finish, flooring and painting packages toward the 2031 completion.

HVACelectricalfire protectionflooringpainting

UCSF Real Estate, 2026-09 (opens in a new tab)

Kaiser Permanente San Francisco hospital replacement (Geary and Divisadero)

623,000 sq ft

Under wayPlans filed with the city 2026; construction start targeted late 2028

A proposed 14-story, all-electric hospital with 300 private beds across from Kaiser's existing Geary Boulevard medical center in San Francisco, plus a medical office building and two parking garages.

This is a long-lead pipeline item: entitlement runs into 2028, then an all-electric hospital means heavy electrical and HVAC scopes, and conversion of the old hospital to medical offices adds later renovation work.

electricalHVACfire protectionconstruction

SFist (citing San Francisco Chronicle), 2026-04-21 (opens in a new tab)

Innovative Genomics Institute-Bakar Labs Building, UC Berkeley

Under wayUnder construction (broke ground July 1, 2026)

A research and startup lab building at Oxford Street and University Avenue in Berkeley for CRISPR-based genomics research and Bakar Labs biotech companies, built by Turner Construction.

Wet labs carry dense HVAC, exhaust and electrical requirements plus fire protection, and finished lab space needs specialty flooring and recurring lab cleaning contracts.

HVACelectricalfire protectionflooringcleaning

California Construction News, 2026-07-06 (opens in a new tab)

AVAIO Digital Pittsburg data center (Phase One)

99 megawatts

Under wayPhase One under construction; two more phases planned

A data center on the former Delta View Golf Course site along West Leland Road in Pittsburg, Contra Costa County, with a first phase of 99 megawatts and potential expansion to 500 megawatts.

Data center phases bring large electrical, cooling and fire suppression packages, and the 76-acre site adds paving and landscaping; opposition and a pending lawsuit could affect later phases.

electricalHVACfire protectionpavinglandscaping

CBS San Francisco, 2026-07-20 (opens in a new tab)
Market view

What we see in San Francisco

Three hospital jobs set the calendar for Bay Area mechanical, electrical and fire protection contractors. UCSF Health's Helen Diller Hospital at Parnassus Heights is in structural steel with completion expected in 2029, and the new building at UCSF Benioff Children's Hospital Oakland runs to 2031. Kaiser Permanente filed plans in 2026 for an all-electric replacement hospital at Geary and Divisadero, with construction targeted for late 2028. Kaiser runs its Northern California region from Oakland, so one owner holds hospitals and medical office buildings from the East Bay to the Peninsula. Getting in front of that facilities team now beats finding the job on a bid list later.

The thinnest benches are in exterior and finish work. The five counties have 41 commercial roofing contractors for 6,175 larger buyer sites, which ranks #4 of 89 markets for room, and commercial painting ranks #3 with only 60 firms. Managed service providers face the opposite: 3,002 of them, ranking #72, so an MSP here wins on a sharper list rather than a longer one.

San Francisco's own permits describe a city that renovates more than it builds. The Department of Building Inspection issued 4,742 commercial permits from October 1, 2025 to September 30, 2026, and 4,469 were over-the-counter alterations against 11 for new construction. That is tenant improvement and repair work inside existing offices, restaurants and shops. The bigger call list sits across the bay: Alameda County holds 37% of the metro's larger buyer sites, ahead of San Francisco County at 21%.

Abstrakt's reading of the sourced figures and projects above, written .

Decision-makers

Who signs, and how many of them work in San Francisco

43,520 general and operations managers, 23,830 computer and information systems managers and 11,980 medical and health services managers work in the San Francisco-Oakland-Fremont, CA metro. Jobs across every industry, not a contact list.

Jobs and median annual pay by title, San Francisco-Oakland-Fremont, CA
TitleJobsMedian payTrades that call this title first
General and operations managers
SOC 11-1021
43,520$149,990MSP
Computer and information systems managers
SOC 11-3021
23,830$232,890
Medical and health services managers
SOC 11-9111
11,980$166,310
Property, real estate, and community association managers
SOC 11-9141
7,660$82,540landscaping, painting, paving
Buyers and purchasing agents
SOC 13-1020
6,300$93,600
Construction managers
SOC 11-9021
5,160$166,030
Facilities managers
SOC 11-3013
3,100$134,230cleaning, construction, electrical, flooring, roofing, fire protection, HVAC
Education administrators, postsecondary
SOC 11-9033
1,720$136,030
Purchasing managers
SOC 11-3061
1,320$170,440

Source: U.S. Bureau of Labor Statistics, Occupational Employment and Wage Statistics (OEWS) (opens in a new tab), May 2025, San Francisco-Oakland-Fremont, CA, all industries. Each title is the closest BLS occupation to a role in the trade's playbook; titles BLS does not publish for this metro are left out. Each trade link opens the San Francisco guide's decision-maker questions.

Opportunity estimator

What Could Your Next 12 Months in San Francisco Look Like?

A planning model, not a forecast: put in your own numbers and it applies Abstrakt's national sales center rates for your trade.

Default 16.1%: Abstrakt national rate for this trade. Use your own if you know it.

Baseline, 12 months

12,000prospecting dials
86meetings set
22proposals
3.6customers won
$89,355first-year value of those customers
Scenarios
ScenarioDials per meetingMeetingsCustomers wonFirst-year value
Conservative190632.6$65,841
Baseline140863.6$89,355
Optimistic1081114.6$115,831
Get My San Francisco Opportunity Assessment

How it works. Meetings are dials divided by dials per appointment; proposals, customers won and value follow from the proposal rate, the win rate and your customer value. The rates are Abstrakt sales center, Performance Intelligence, national, October 2026, across all programs, not San Francisco results; the scenarios use the slower and faster quarter of buyer industries. Outbound results typically build over 6 to 12 months, so a first year rarely runs at a full year's pace. Benchmarks by trade and method.

Hiring locally

What an in-house SDR costs in San Francisco

  • 29,980people in the role locally, all competing for the same hires

Source: U.S. Bureau of Labor Statistics, Occupational Employment and Wage Statistics (OEWS), May 2025. Sales representatives of services, except advertising, insurance, financial services and travel (SOC 41-3091).

In-house SDR, first year (illustrative)$124,700

An illustrative model, not a quote: in-house adds $15,000 commission, 25% payroll taxes and benefits, $550/month tools, $7,000 recruiting and training, 35% yearly turnover, and manager, QA and admin time, before ramp time. Abstrakt includes the SDR, management, tools and data.

Local sales intelligence

See how a San Francisco program is built in Abstrakt Intelligence

Ava walks through the platform our strategists use, set to San Francisco.

Abstrakt Intelligence

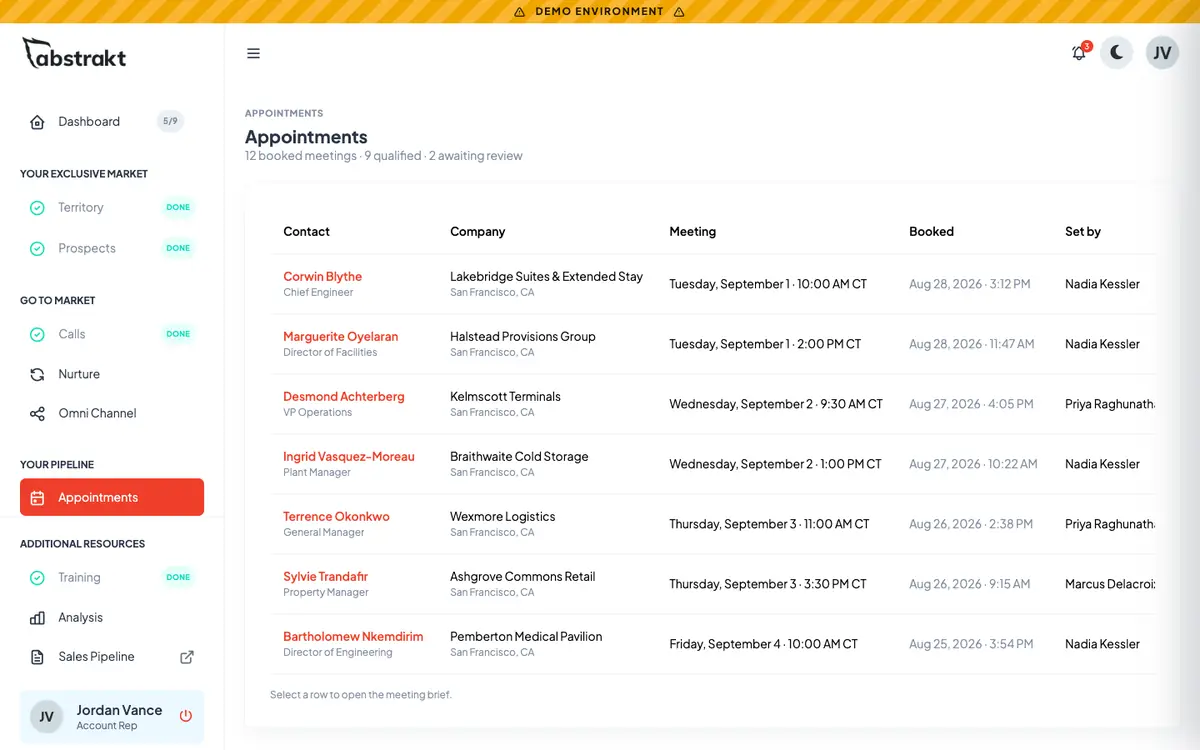
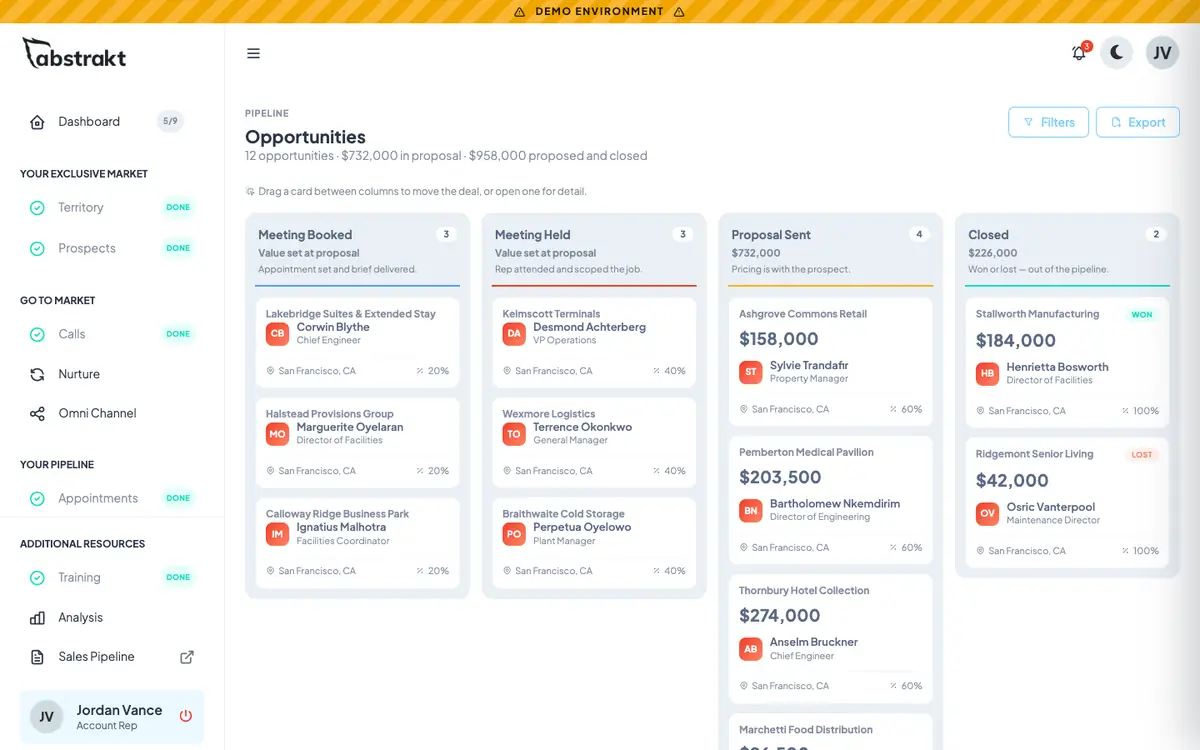
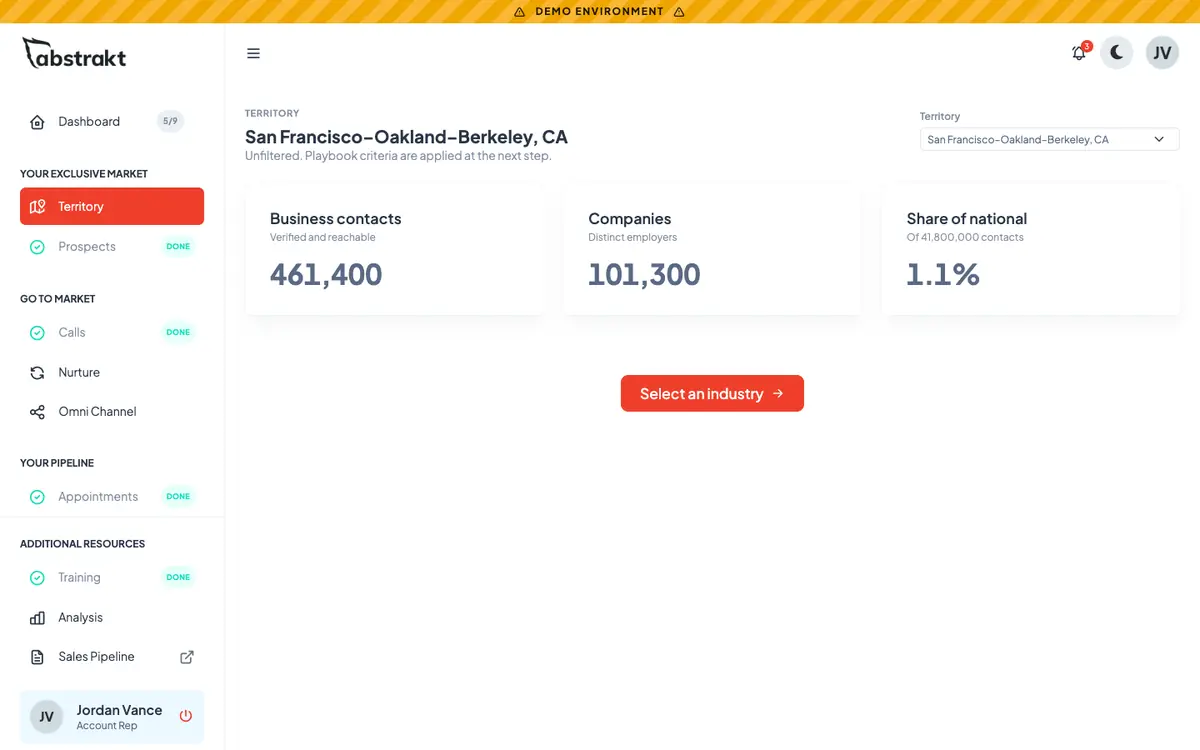
This demonstration showcases real Abstrakt Intelligence capabilities using fictional companies and contacts to protect client and prospect privacy. Ava is Abstrakt's AI guide. The screens are the demo set to the San Francisco territory; its territory counts come from the demo data, not the Census figures above.

Read the transcript of Ava's San Francisco walkthrough

Hi, I'm Ava.

Here's what an Abstrakt program looks like in San Francisco.

First, we size your territory.

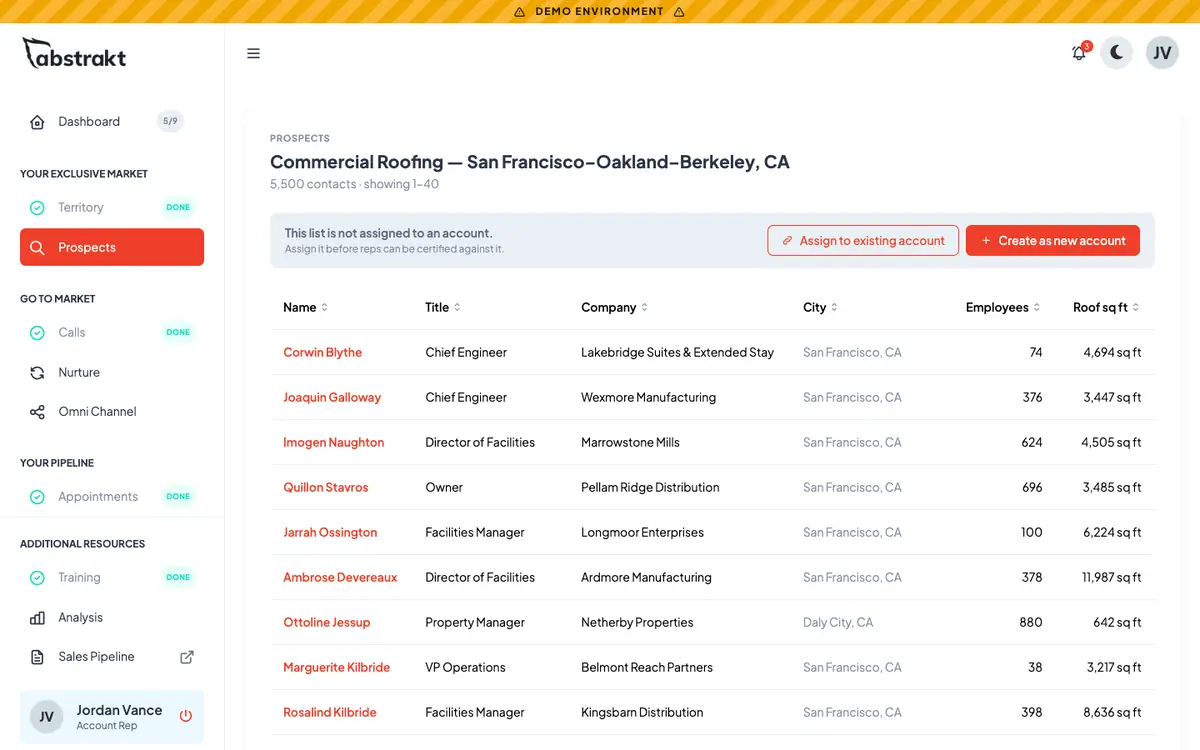
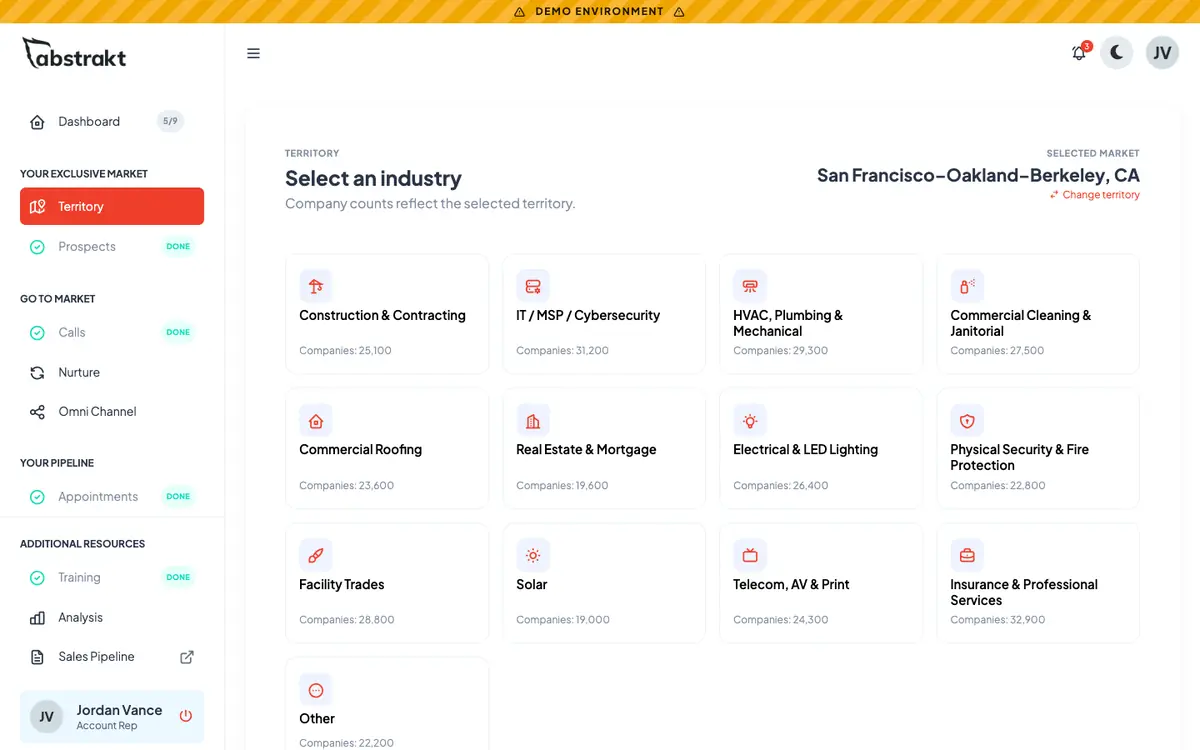
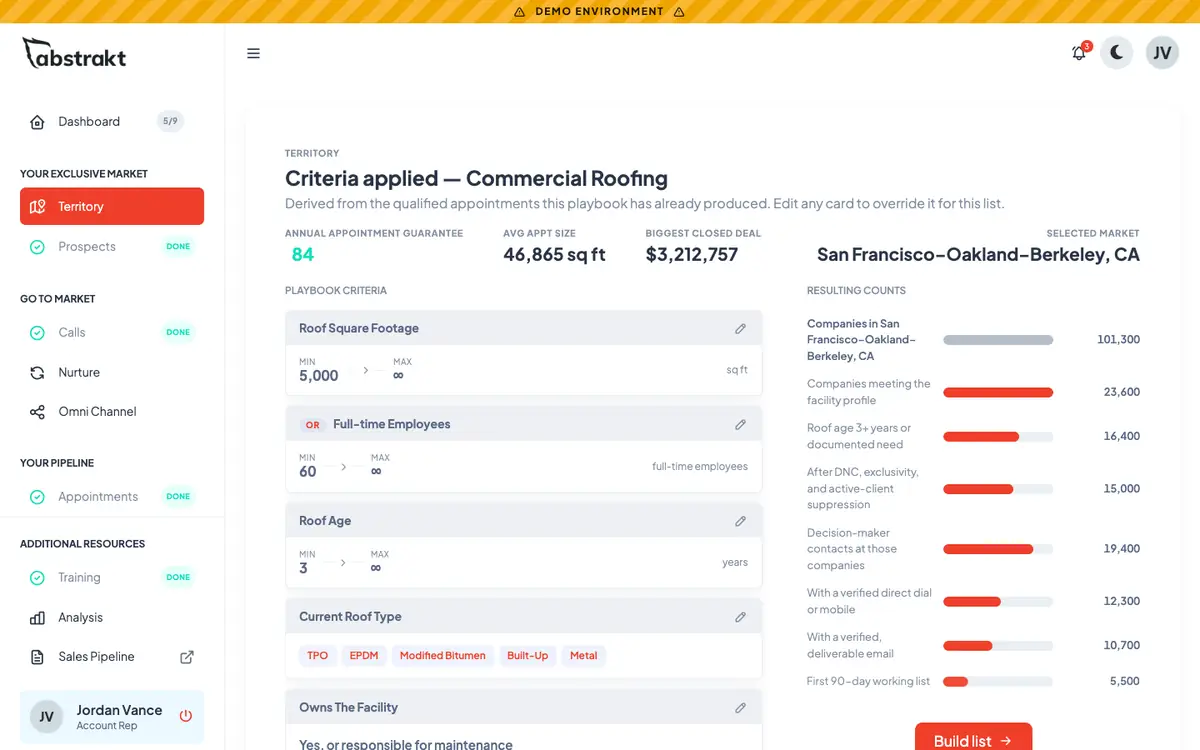
The San Francisco area has about 101 thousand companies and 461 thousand business contacts.

Next, we pick the playbook for your industry.

Each playbook starts with criteria that have already booked meetings.

For roofing, that's roof size, roof age and who owns the building.

Then we build the list.

Anyone who isn't a fit comes off before a rep ever sees the name.

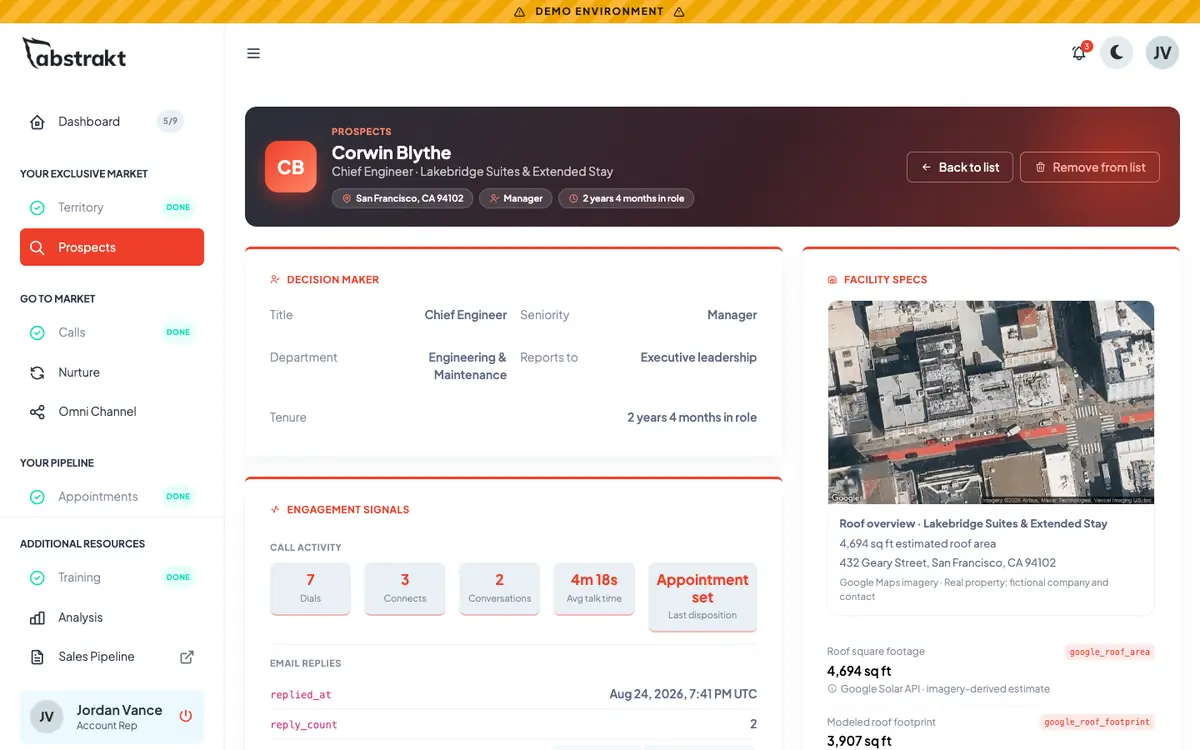
Every prospect gets a full profile.

The decision-maker, the building, and every touch so far.

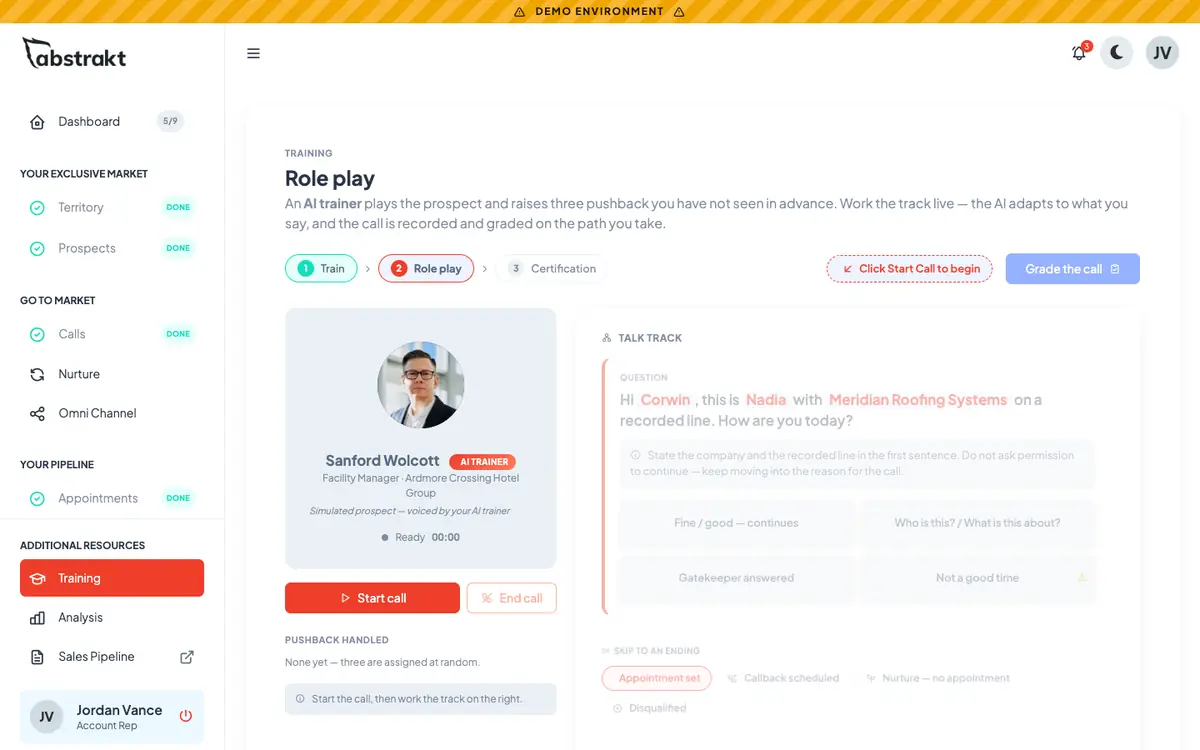
Before the first dial, each rep practices in an AI role play and gets certified.

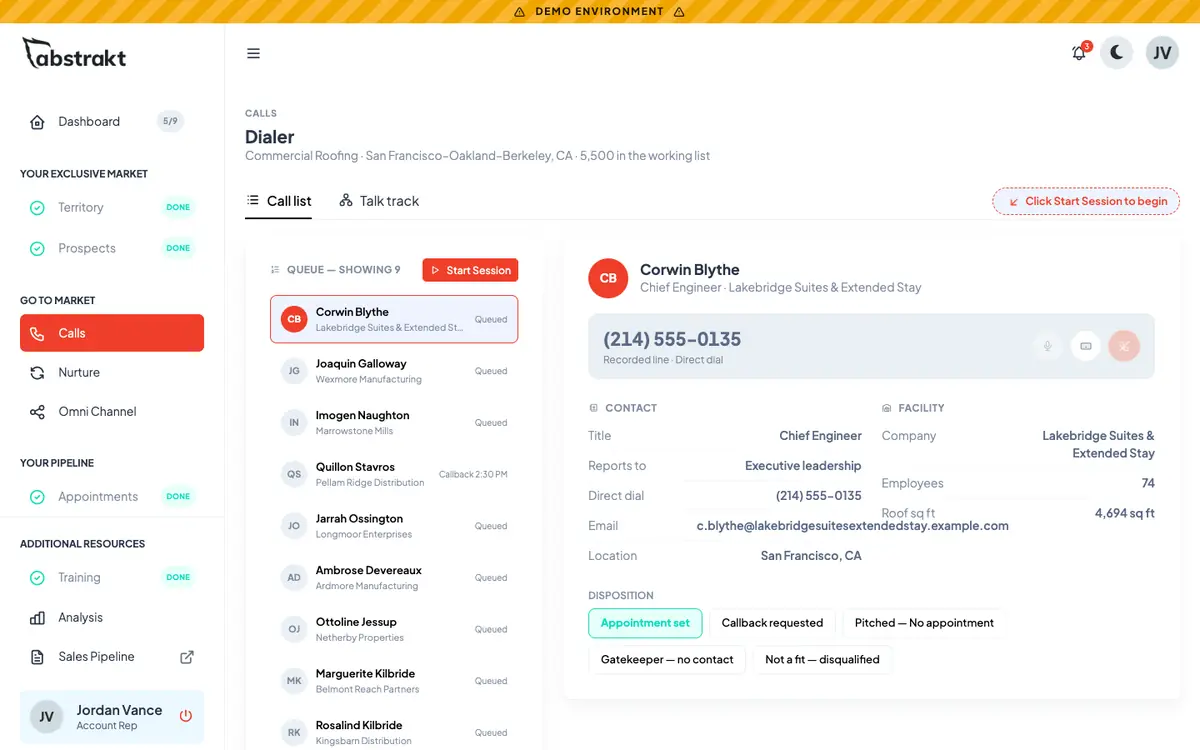
Now the calls start.

The dialer, the talk track and the follow-up all live in one place.

Every meeting is reviewed for quality before it reaches you.

And we track each one all the way to closed.

We take one client per trade per territory.

Once a spot is taken, it's gone.

Check if your trade is still open in San Francisco.

Client results

Results from programs like this one

Each story is labeled with where the program ran. Abstrakt runs every program from its St. Louis sales floor.

  • Commercial cleaningLocal program, Tulsa

    How Century Facility Services broke its referral ceiling: $415K closed in year one

    Century Facility Services

    After losing a sales rep, Century Facility Services outsourced outbound and booked 58 appointments and closed $415K in year one.

    • 58 appointments booked
    • 7 deals closed
    • $415K closed business

    First year of the program (case published April 2026)

  • Commercial roofingRegional

    How Schena Roofing booked 475 appointments and kept a seasonal calendar full

    Schena Roofing & Sheet Metal

    Schena Roofing booked 475 appointments and closed $1.69M from 2018 to 2024, with another $1.39M in proposals delivered.

    • 475 appointments
    • $1.69M closed business
    • $1.39M in proposals delivered

    2018 to 2024, from Abstrakt program records. Closed business and proposals delivered are separate figures.

  • Fire protectionLocal program, Philadelphia

    How Harring Fire Protection turned outbound and inbound into $200K in new business

    Harring Fire Protection

    Outbound appointment setting plus an inbound website produced 195 appointments and 16 closed deals worth $200K in 28 months.

    • 195 appointments booked
    • 16 deals closed
    • $200K closed business

    28-month partnership (case published April 2026); search figures within 12 months of the February 2025 site launch

See all client stories

Outsourced sales development

How Abstrakt runs a San Francisco program

Reps on Abstrakt's St. Louis sales floor work your San Francisco-Oakland list by phone, email, LinkedIn and direct mail after two weeks of training and certification on your account.

Contractor licensing in California

CSLB licenses contractors by classification, with a B General Building license and C specialty licenses for individual trades. A license is required for any job of $1,000 or more (labor and materials), or any job that needs a permit or uses hired workers, since January 1, 2025.

Confirm with Contractors State License Board (CSLB) (opens in a new tab). Checked 2026-09-30.

Free market report

The State of Outbound Sales in San Francisco, 2026

This page's San Francisco data in one report for your team, with the California calling rules. No form to fill in.

Free trade territory report · PDF

Get the territory report for your trade in San Francisco

One trade, one city, every page about your market: the account types that buy your work here and how many of each, Tier 1 sites, the counties to start in, who signs and what to ask them, the months that matter, federal contracts and permits, the California calling rules, and whether the territory is still open. One client per trade per territory.

  • Account tiers and a worked first-list example
  • Decision-maker roles, questions and objections
  • A 90-day calling plan sized to the San Francisco counts

Send me the report

Free. The download starts as soon as you press the button, and the next page links it again. We use your details to follow up about it. Privacy Policy.

Territory assessment

See Your San Francisco Sales Opportunity

A Partner Sales Manager sizes your San Francisco territory for your trade, checks whether it is open (one client per trade per territory) and shows what a program would look like.

Program commitments, including activity and meeting expectations, are defined in your agreement before launch.

Get My Territory Assessment

All fields are required.

We use your details only to prepare and discuss your assessment. See our Privacy Policy (opens in a new tab).

Outsourced sales development in San Francisco, answered

Does Abstrakt provide B2B lead generation and appointment setting in San Francisco?

Yes. Abstrakt runs outsourced lead generation and B2B appointment setting across the San Francisco-Oakland-Fremont, CA metro from its St. Louis sales floor: U.S.-based reps prospect the buildings, qualify the opportunity and book meetings with the person who signs. We take one client per trade per territory.

How does B2B appointment setting work for a San Francisco program?

It starts with the list. Of the 9,941 sites in San Francisco-Oakland with 20 or more people on site, we keep the ones that buy your trade inside your service area, then a certified rep works them by phone, email, LinkedIn and direct mail. Meetings are booked with the decision-maker, reviewed before they reach you and tracked to a proposal and a close.

Which commercial trades have the most room to grow in San Francisco?

Measured by larger buyer sites per contractor across the markets we track (a market is ranked for a trade only where it has at least 10 local contractors), commercial painting & coatings (#3 of 86), paving & asphalt (#4 of 94) and commercial roofing (#4 of 89) rank best in San Francisco.

What kinds of businesses are concentrated in San Francisco?

Compared with the national mix, San Francisco-Oakland has more apartment and residential property managers (1.21x). Those industries are the best-represented buyers for trades that serve them.

Is the San Francisco business market growing?

Yes, on both counts below. Private business establishments across San Francisco-Oakland's counties went from 201,904 in 2021 to 222,839 in 2025 (+10.4%), and private employment +2.3% (U.S. Bureau of Labor Statistics, Quarterly Census of Employment and Wages, annual averages). In the latest Census count, 12,649 establishments opened and 11,807 closed in the metro (U.S. Census Bureau, Business Dynamics Statistics, 2023, March to March), so openings ran ahead of closings by 842.

How much federal construction money is spent in San Francisco?

Federal contract obligations with a place of performance in San Francisco-Oakland's counties came to $9.35 billion in federal fiscal year 2026 (October 2025 to September 2026), $350.5 million of it in construction (NAICS 23) (USAspending.gov (U.S. Department of the Treasury), retrieved 2026-10-15). Fiscal 2026 will still rise as delayed defense contract actions post.

How many commercial building permits are issued in San Francisco?

City and County of San Francisco issued 4,742 commercial permits between October 1, 2025 and September 30, 2026. That count covers only the permits City and County of San Francisco issues, not the metro. Source: each jurisdiction's open-data permit layer, retrieved 2026-10-15.

Which Bay Area hospital projects should mechanical and electrical contractors track?

Start with UCSF's Helen Diller Hospital at Parnassus Heights, due in 2029, and the new UCSF Benioff Children's Hospital Oakland building, due in 2031. At Parnassus, structural steel and concrete run through summer 2027, then mechanical, electrical and fire protection rough-in ramps up. Kaiser Permanente's replacement hospital at Geary and Divisadero is further out, with construction targeted for late 2028, which gives contractors time to meet the owner before packages go out.

Which trades have the most room in the San Francisco Bay Area?

Commercial painting, roofing, paving and flooring. Painting ranks #3 of 86 markets for larger buyer sites per contractor, and roofing, paving and flooring each rank #4 in their comparisons. Roofing works out to 150.6 larger buyer sites per contractor, with retail stores as the biggest buyer group for painting, roofing and paving.

Which counties make up the San Francisco market?

The metro covers 5 counties. Alameda County, San Francisco County and Contra Costa County hold 77% of the larger business sites, so most programs start there.

What does outsourced sales development cost in San Francisco?

Starting at $5,000 per month for an Outbound BDR program, as a flat monthly program. The price depends on how many reps work your program, the channels, and how large a territory and how many trades it covers. For comparison, one in-house SDR costs about $124,700 in year one at a $55,000 base salary on our illustrative model, before ramp time.

Sources and method

Updated . Approved the local markets plan: the data sources, the method and the in-house SDR cost model shown on market pages: Scott Scully, Executive Chairman, October 15, 2026. Every figure is regenerated from its source by a script in the site's code, never typed by hand.

Sales Talk newsletter

Get Sales Talk in your inbox

New playbooks, benchmarks and guides from our sales floor, for owners and sales leaders who sell to businesses. One email a month. See past issues.

Your email and the details you choose to add, nothing else. We never sell or share your address, and every issue has a one-click unsubscribe. Privacy Policy.

Check my marketCall us